Your quarterly business review deck, from notes and KPIs
DeckDash turns your KPI spreadsheet and notes into a quarterly business review (QBR) deck: a goals-versus-results scorecard, native editable charts, wins, misses and the decisions you need, usually 10 to 15 slides as PowerPoint plus PDF in 24 to 48 hours, from $20. Charts are built only from the numbers you send.
Last updated
Typical slide outline
- Executive summary: The quarter on one slide: headline result, top win, top miss, the ask.
- Goals vs results: A scorecard of last quarter's targets with actuals and status.
- KPI trends: Native charts of the 3 to 5 metrics that matter, with the period clearly labelled.
- Wins: What went well and why.
- Misses and root causes: What fell short, why, and what changes.
- Customer / team highlights: Notable accounts, launches or hires.
- Next quarter priorities: 3 to 5 goals with owners and targets.
- Decisions needed: What you need leadership or the client to approve.
- Appendix: Detailed tables and definitions.
How many slides?
A QBR usually works as 10 to 15 main slides plus an appendix for the detail. Put one message on each slide, written as the slide headline (for example, "Churn fell to 2.1% after the onboarding change"), so the deck reads without you.
What to send us
- The KPI data as a spreadsheet or CSV (with the period for each figure)
- Last quarter's goals or OKRs
- Your notes on wins, misses and causes
- Who the audience is: internal leadership, the board or a client
- Your company slide template, if you must use one
Common mistakes we fix
- A data dump: twenty charts and no conclusion
- Hiding misses, which costs more trust than the miss itself
- Mixing periods (month, quarter, year-to-date) without labels
- No decisions requested, so the meeting changes nothing
- Charts pasted as images that nobody can update next quarter
Which tier fits
Standard ($45) for native, editable charts and your template; Premium ($90) if you want speaker notes and an appendix of detailed tables.
See a matching sample
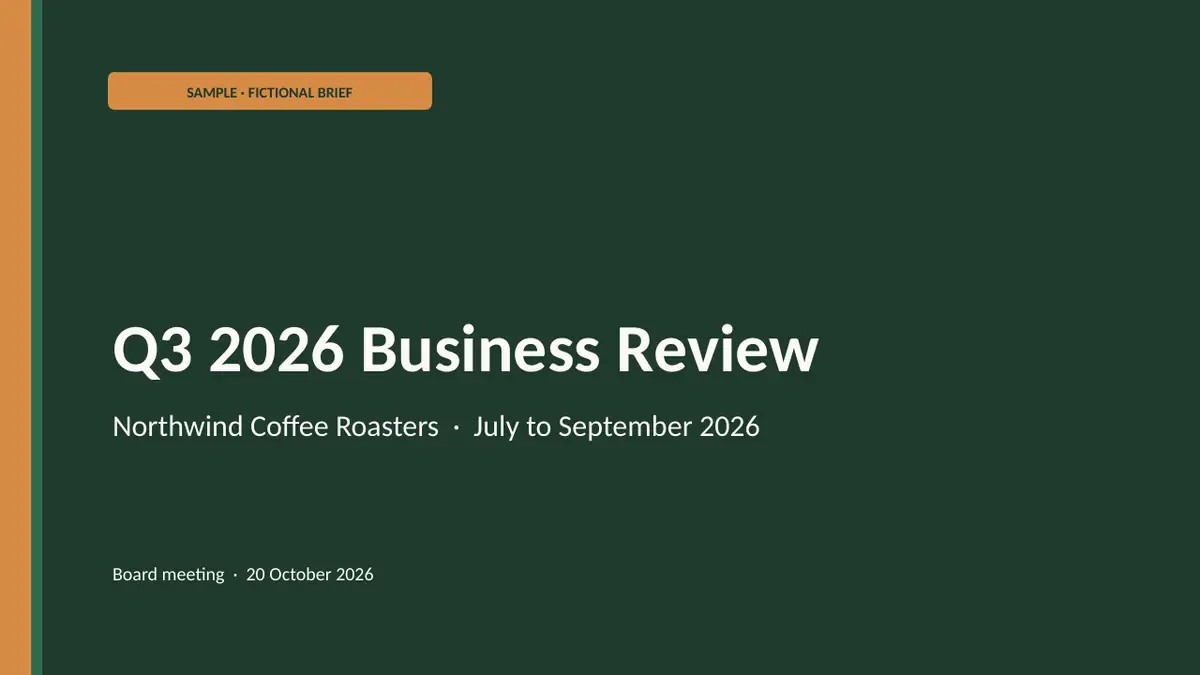
Northwind Coffee Roasters Q3 2026 (fictional)
Free template
Prefer to build it yourself? Download our free Quarterly Business Review Template (.pptx, no sign-up).
Questions about this deck type
Will the charts update if I change the numbers?
Yes. Charts are native PowerPoint charts, so you can edit the underlying data in PowerPoint next quarter.
Do you analyse the data for us?
We chart and summarise what you send and can point out what the numbers show, but every figure comes from your data. We don't invent or estimate numbers.